PACMAN
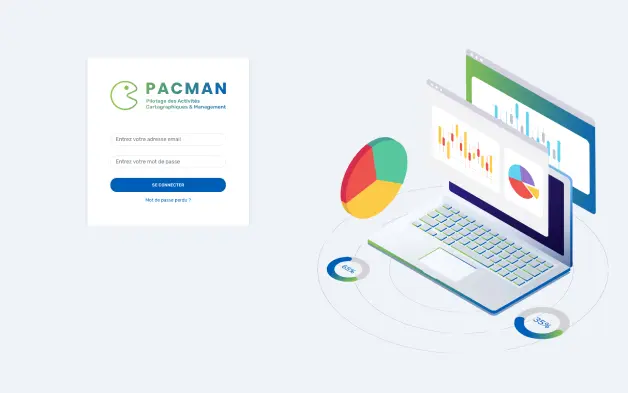
This platform was in production for more than a year when we started this project. Since their client expressed new feature requests, the agency 3DO2 asked me to make the second version of this reporting tool. For this overhaul, Elsa from Studio Mund produced a Brand Book: a new logo was made and the graphical identity was completely reimagined by accentuating things on accessibility and UX.
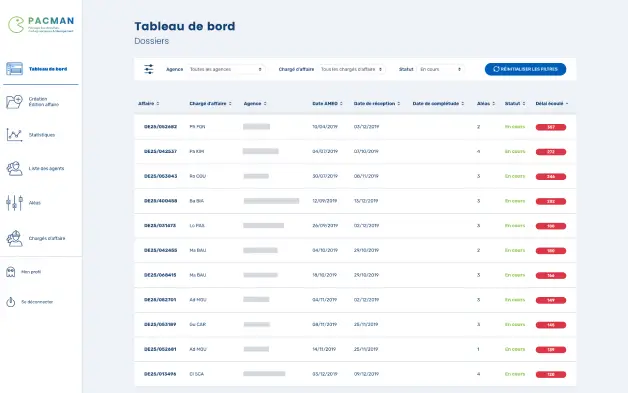
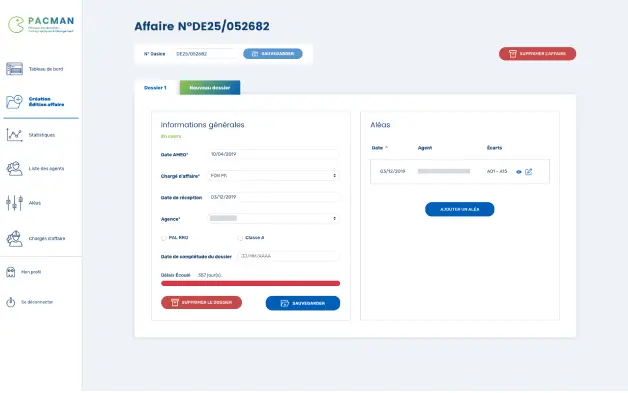
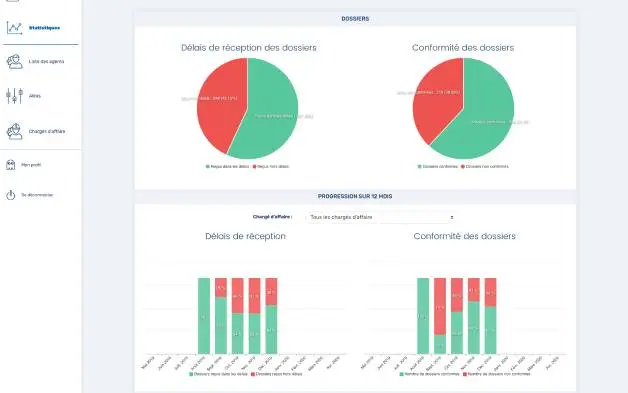
The first goal of this tool is quality control for teams associated with Enedis. For this, users are able to enter the data regarding their projects and the system automatically computes procedure times (modulated by a custom-built issue ticketing system) and adds a visual marker in case projects take too long to be resolved. Managing teams are then able to generate performance statistics depending on a given time frame.
From a technical point of view, the platform stands on a Symfony-based API. A Vue.js front-end GUI is then fed by it. Statistics are generated using ApexCharts which thanks to its vector rendering allows for printing without visual artifacts.
Client: 3DO2 / Enedis
Used for this project:
- Symfony
- Vue.js
- Axios
- Lodash
- Moment.js
- ApexCharts
- Babel
- Eslint
- SCSS
- Webpack